


As of mid-2026, the median home price in Washington, D.C. sits around $747,000, while homes in Seattle’s Capitol Hill are selling for roughly $792,000. Those are close enough numbers that buyers weighing the pros and cons of living in Capitol Hill sometimes assume these two markets are interchangeable. They’re not.
Both areas are dense, transit-oriented, and expensive. But the housing stock, the market pace, and the day-to-day experience of living in each place are quite different – and if you’re weighing one against the other for a 2026 purchase, those differences matter more than the headline prices suggest. Property types, commute infrastructure, and local tax structures all feed into what ownership actually costs you here.
Washington, D.C. is an entire major metropolitan city with distinct quadrants and dozens of neighborhoods, including its own famous Capitol Hill area. Seattle’s Capitol Hill, by contrast, is a single dense neighborhood sitting just east of downtown. That distinction shapes everything from how you shop for a home to how long you’ll spend commuting.
Understanding the Layouts of Seattle’s Capitol Hill and the District of Columbia
Washington, D.C. operates as a federal district covering over 60 square miles. The housing market inside that footprint is genuinely varied – historic Northwest co-ops, newer condo developments, the iconic rowhouses of D.C.’s own Capitol Hill neighborhood. Across the District, homes are currently selling in an average of 44 days.
Seattle’s Capitol Hill is a different kind of place entirely. It functions as an urban center within a larger city, and the market there moves considerably faster. About 110 active listings, homes averaging just 21 days on the market, and a mix of historic single-family homes and high-density condo buildings competing for the same pool of buyers.
Common Property Types and Architectural Styles
Washington, D.C. offers detached homes, boutique condo buildings, and renovated historic properties across its various neighborhoods. D.C.’s Capitol Hill specifically is known for its classic historic rowhouses. Head into the Northwest quadrant and you’ll also find a notable segment of cooperative housing alongside modern condos in newer developments.
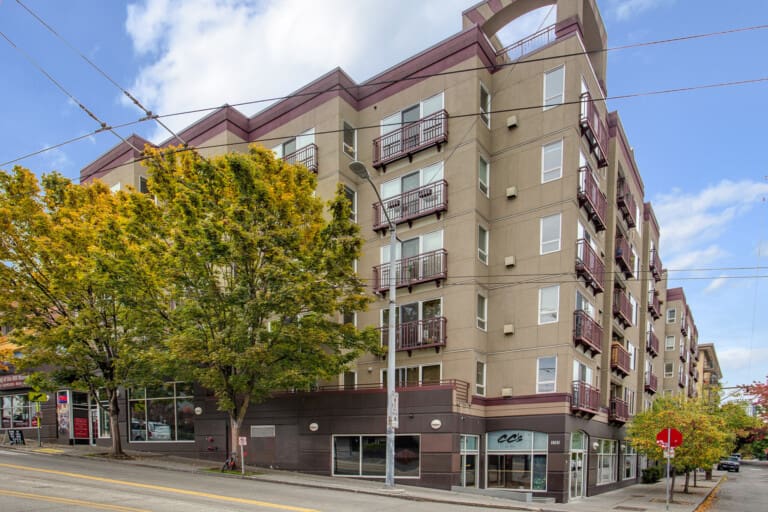
Seattle’s Capitol Hill blends historic single-family homes with modern condominiums, townhomes, and apartment buildings. Condos are one of the most common housing types in the neighborhood. It also shares one specific trait with D.C. and New York: a notable number of condo co-op buildings. On the residential streets, you’ll find classic Craftsman, Tudor, and Colonial Revival-style homes – no rowhouses, but plenty of character.
Property Tax Rates and Local Fees
King County, WA levies an effective property tax rate of about 0.83%, which translates to a median annual property tax bill of roughly $7,114 to $7,644 for a typical homeowner. The county’s overall 2026 property tax levy totaled $8.4 billion – a 10% increase from 2025, driven mainly by voter-approved levies rather than rising home values.
The District of Columbia’s Class 1 residential rate sits around $0.85 per $100 of assessed value, or roughly 0.85%. The two rates are close on paper, but individual assessments and exemptions can move your actual bill in either direction. Verify your specific obligations directly with the D.C. Office of Tax and Revenue before you budget.
Housing Markets, Home Prices, and Property Types
Seattle’s Capitol Hill sees roughly 95 homes sold in a recent 30-day window, with properties selling for about 99% of their list price. That’s a tight market – buyers aren’t getting much room to negotiate, and things move quickly.
The median sale price in Seattle’s Capitol Hill is currently around $792,000, up nearly 5% year-over-year. Earlier estimates often skewed lower, around $615,500, because the high volume of small condominiums pulls the overall median down. Factor in the single-family homes that have recently sold and the neighborhood’s median pushes closer to that $792,000 figure.
Washington, D.C. tells a more layered story. Over the three-month period ending in May 2026, the median sale price across the District reached $747,000, representing a 6.2% year-over-year increase. Other sources tracking the D.C. market have reported lower medians in the $580,000 to $620,000 range, depending on the exact timeframe and property mix. The spread there reflects how much D.C.’s market varies by neighborhood and property type.
Transit and Daily Commute Options
Commute infrastructure shapes daily life in both of these places more than it would in a suburban market. Residents in both locations lean heavily on public transit rather than personal vehicles, and access to rail lines and bus routes factors directly into property values.
That said, the scale is very different. Washington, D.C. runs a massive transit network serving hundreds of thousands of commuters daily across multiple states. Seattle’s Capitol Hill operates on a smaller, more localized scale within King County. Both areas prioritize public infrastructure and walkability, but a commuter coming from D.C. will need to recalibrate their expectations about network coverage.
Light Rail and Metro Systems
Washington, D.C. operates the Metro system (WMATA), which serves neighborhoods citywide via multiple rail lines. Residents of D.C.’s Capitol Hill neighborhood use the Blue, Orange, and Silver Metrorail lines at the Capitol South and Eastern Market stations. WMATA also provides extensive Metrobus service across the district, supported by Capital Bikeshare infrastructure.
Seattle’s Capitol Hill has its own car-light culture, backed by a dense, walkable layout and the Capitol Hill Link light rail station, which connects residents to downtown Seattle in minutes. South Lake Union is also easily reachable via public transit or a short drive. Many locals here get by without a car entirely – light rail, biking, and walking cover most of it.
Local Zoning and Civic Development
Zoning dictates what can be built near a home you’re considering, and that matters more than buyers sometimes realize. You can research this through the municipal planning departments in King County or the District of Columbia. Both cities maintain public portals where you can review permit applications, upcoming construction projects, and transit expansion plans near a specific address.
Official city channels are the right place for this kind of research. Both cities also publish civic service schedules and community board meeting information through those same portals.
How to Research Local Neighborhood Data
If you’re seriously comparing these two markets, start with the official municipal resources for zoning rules, civic services, and neighborhood data – not third-party aggregators, which often run on outdated numbers. Local government portals are the most reliable starting point.
That applies to development plans, too. Zoning decisions made today shape what the block around your potential home looks like in five years, and the planning departments in King County and the District of Columbia both make that information publicly available.
Finding Official Safety Statistics
For Seattle’s Capitol Hill, the Seattle Police Department publishes neighborhood-level incident reports and public safety updates directly on their website. That’s your primary source – not aggregated crime score tools.
For Washington, D.C., the Metropolitan Police Department publishes official safety statistics and data covering all city quadrants. Both departments let you get granular, down to specific blocks and intersections, which is the level of detail that actually helps when you’re evaluating a specific property.
Accessing Municipal and Civic Services
Local zoning regulations are worth reviewing before you make an offer – knowing what can be built on adjacent parcels tells you something about what the neighborhood might look like in a few years. The District of Columbia and King County both provide online resources for this.
Those same portals cover trash collection schedules, neighborhood council meetings, and other day-to-day logistics. It’s not glamorous research, but it’s the kind of thing that affects how you actually feel about a place once you’re living there.
Frequently Asked Questions
How do median home prices in Capitol Hill, Seattle compare to Capitol Hill in Washington, D.C.?
It depends on the property type and where exactly in D.C. you’re looking, but Seattle’s Capitol Hill is currently tracking higher. As of mid-2026, the median sale price in Seattle’s Capitol Hill is roughly $792,000. The median sale price across the entire District of Columbia sits around $747,000, though some sources report D.C. medians closer to the $580,000 to $620,000 range, depending on the timeframe and property mix.
Will I find the same style of historic rowhouses in Capitol Hill, Seattle that are common in D.C.?
No – the architectural styles are quite different. D.C.’s Capitol Hill is known for its historic rowhouses. Seattle’s Capitol Hill features classic Craftsman, Tudor, and Colonial Revival-style single-family homes. Both areas do offer modern condominiums and co-op buildings.
What is the biggest difference in property taxes when relocating from D.C. to Capitol Hill, Seattle?
The rates are close but the billing structures differ. King County, WA applies an effective property tax rate of about 0.83%, driven partly by voter-approved levies. The District of Columbia’s residential property tax rate is around $0.85 per $100 of assessed value. Verify your specific situation with the relevant tax authority before you finalize your numbers.
Is it as easy to live car-free and rely on public transit in Seattle’s Capitol Hill as it is in Washington, D.C.?
Both areas support a car-light lifestyle well. Seattle’s Capitol Hill has a dense, walkable layout and a Link light rail station connecting to downtown in minutes. Washington, D.C. offers a similar experience through its WMATA Metrorail and Metrobus systems, though the D.C. network is considerably larger in scale.
Are bidding wars more competitive for buyers in Capitol Hill, Seattle compared to the D.C. real estate market?
Seattle’s Capitol Hill moves faster by the numbers. Homes there average just 21 days on the market and sell for roughly 99% of their list price. In Washington, D.C., homes sell after an average of 44 days – which gives buyers a bit more breathing room, relatively speaking.
How much lead time do I need to coordinate selling a property in D.C. and buying a home in Capitol Hill (Seattle), WA?
Plan for several months, at minimum. D.C. homes take an average of 44 days to sell. Available homes in Seattle’s Capitol Hill are moving in about 21 days. Those are two different market speeds running simultaneously, and coordinating a cross-country move around both requires more runway than most buyers initially expect.